Thursday 13 January 2000

SDS Price Levels Alert Indicator

Introduction


This indicator alerts you when certain price levels are reached. The alert can be on an intrabar basis or on a closing price basis. It will also send alerts when one forms, including via e-mail or push notification to your phone. It's ideal for when you want to be notified of a price level being reached but don't want to have to sit in front of your chart all day.
The Price Level indicator plots a dot each bar to show where the alert level is

Input Parameters


DoAlert: if set to true a desktop pop-up alert will appear from your MetaTrader terminal when the price level is breached.

DoNotification: if set to true then a push notification message will appear on your MetaTrader smart phone app

DoEmail: if set to true then an e-mail will be sent to your e-mail address with the alert information in

TradeLevelType: this is either TradeAbove when you want to be alerted when the market trades above your input price level or TradeBelow.

Level: this is the price level to be monitored and needs to be set accordingly.

OnCloseOnly: if set to true then the alert will only be triggered if the bar closes beyond the price level

TradeAboveClr: this is the colour to use for plotting the price level if it's to be triggered by the market trading above the level

TradeBelowClr: this is the colour to use for plotting the price level if it's to be triggered by the market trading below the level

PlotSymbol: this is the Wingdings symbol code that will be used to mark the price level that is being monitored. You can choose from any of the Wingdings codes (see the chart below)


Wingdings codes

Wednesday 12 January 2000

Metatrader SDS_TradeManager EA - Installation Instructions

This post is specifically on how to install and register the Metatrader SDS_TradeManager EA

The Metatrader SDS Trade Manager EA will be supplied to you as two files:

SDS_TradeManager.ex4
SDSMT4Reg.dll

The first one is a standard EA and is installed in the usual way (see below if you don't know how to do this). The second file however is a Windows DLL library file which needs to be installed in a different location. After installation you'll need to register your software as well. This is also described in this post.

A. Installing the SDS_TradeManager EA

1. Go to your Metatrader charting software and select the File | Open Data Folder menu option. This will open up your Windows Explorer at the appropriate folder.

2. You will see a selection of folders. Double click on the MQL4 folder which will lead you to the following folders

3. As the SDS Trade Manager EA is an Expert Advisor you need to navigate into the Experts folder and save the file there. That's it!


B. Installing the SDSMT4Reg.dll DLL file

1. Repeat the process above except that at step 3 instead of the Experts folder you need to go to the Libraries folder and save the DLL file there.


C. Getting Your Registration Code

The next step is to apply the EA to a chart so that you can get it registered.

1. Firstly you need to get your Mt4 installation to recognise the new files. The easiest way to do this is simply to shut down and restart your Mt4 charting program but you can also go to the Navigator Panel, right click on Experts and select Refresh to update the listing of all your EA's

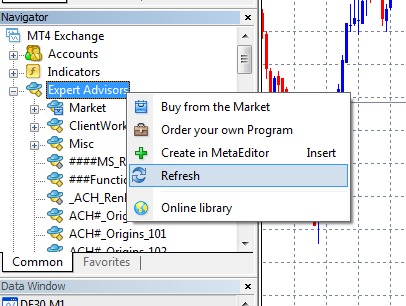
Refreshing the Experts list

2. Once you have done this then you should see the file SDS_TradeManager listed in your Experts folder. Now you need to apply it to chart. Make sure that the AutoTrading button is switched on (so it is showing green) and then drag and drop the EA onto your chart.

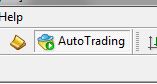
The AutoTrading button

3. This will bring up the Expert SDS_TradeManager input dialog box. Select the Common tab and make sure that Allow DLL imports is ticked. There's no need to bother about the EA inputs until you've registered so for now you can simply click on OK


4. Once you do this then the EA should be applied to the chart so that you see a smiley face in the top right-hand corner of the chart. You should also immediately get an Alert message saying that the software is not yet registered and giving you a Hardware ID code.


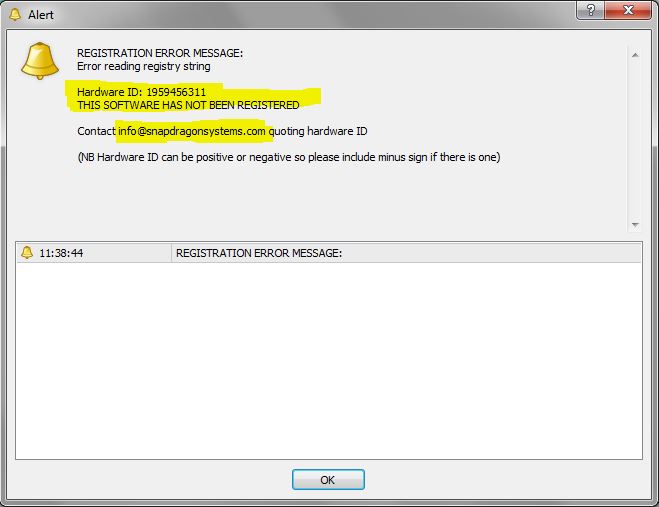
The Alert Message - note, your Hardware ID will be different
5. Make a note of the Hardware ID carefully. It's possible for this number to be positive or negative so please include any minus sign. Then e-mail this to the e-mail address shown on the Alert message dialog box. You will be sent a registration file which you will need to install (see below)


D. Installing Your Registration Code

1. You will be e-mailed a simple registration file with a .reg suffix. Copy this to any convenient location on your computer, then right-click on it and select Merge (this may be different on different Windows operating systems). Alternatively you can simply double-click on it.

2. Again, depending on the operating system, you may well get one or more messages asking if you're sure that want to make changes to your computer and registry and you may need to give Admin permission to this but rest assured that it's just installing a very simply entry to the registry. If you're in any doubt you can open the file in a text editor (it's a simple text file) to see the contents.

3. Once that has been done you can then go back and apply the SDS_TradeManager EA to your chart again and this time there should be no alert message and the smiley face icon should appear in the top right-hand corner of your chart. This means that you've successfully installed and registered your software

Trouble Shooting
Should you find that the EA doesn't work after following all the above steps then here are some points to bear in mind:

1. Look at the Experts tab in the Mt4 Terminal Panel. This will show any error messages which will be very useful.

2. If you see messages about not being able to find or load the DLL then please re-check the following points:
a) the DLL is located in the Libraries sub-folder and not anywhere else
b) the Allow DLL imports button has been checked on the Common input tab.

3. If you still can't get it all to work then e-mail the info@snapdragonsystems.com e-mail address saying what is happening and giving a screenshot of the Experts tab. They will talk you through sorting it all out.


Tuesday 11 January 2000

Metatrader4: SDS Trade Manager EA

Introduction
The SDS_TradeManager EA is a powerful EA designed to manage your positions once you have been filled. It basically works a break-even stop and also a trailing stop where the trigger levels and trail levels are all specified in "R's", that is to say multiples of the initial trade risk. Many successful professional traders think about all their trades and profit taking in terms of multiples of the initial risk R. So for example, if your initial risk on your trade is 50 pips and you want to move to break-even at "2R" then this price level trigger wold be 2 x 50 pips = 100 pips. Similarly for the same trade, you might want to start trailing at 5R and to trail by 2R which would mean that at 250 pips profit you would start trailing your stop loss by 100 pips.

The Trade Manager is action with the break-even triggered at 2R and the trailing stop triggered at 4R


How to use the EA
You basically add the EA to your chart at the start of your trading session where it will sit dormant until it finds an open position on your chart which has a stop-loss attached to it. Please note that without a stop-loss it's impossible for the EA to work out what the initial risk (or R) of the trade is so it can't manage the trade. As soon as it finds such a trade it plots all the R levels for trade (showing the various multiples of the initial risk that the trade might attain if it goes your way). It also marks where the break-even will trigger as well as where the trail will activate as well. You can configure many details of how all this works including the granularity of the adjustments of the trail (e.g. only adjust the trail every 0.5R etc.) and whether the trail is adjusted on an intrabar basis or only on the close of the bar. All the configuration details are explained below.

An example of a short trade


Input Parameters

BE_R: the R level at which the stop-loss is moved to break-even. Note if you don't want to use this functionality then simply make this a very large value

TrlStart_R: the R level at which the trailing stop activates. Note if you don't want to use this functionality then simply make this a very large value

TrlSize_R: this is the amount in R's by which the stop-loss trails behind the market. So a value of 1.5 will trail the stop-loss 1.5 times the initial risk behind the extreme of the move so far

TrlAdj_R: this is the "granularity" of the adjustments to the trailing stop. So with a value of 0.5R here then the stop-loss will only be adjusted every 0.5R and in between this amount no adjustment will be made. If this is set to 0.0 then the stop will be adjusted immediately for every new extreme in the market move.

StopType: this is either "Intrabar" or "OnClose". If the former is selected then every tick the stop is checked to see if it needs adjusting. If the latter is selected then adjustments are only made on the close of each bar

ShowEntryAndStop: if set to true then the EA will draw in the entry and initial stop-loss levels as part of the drawing of the R levels.

ShowRLevels: if set to true then the R levels for the trade will be plotted.

RInterval: this specifies the increment in the R levels for when they are drawn

RLast: this specified the last R value for when they are drawn

NumBarsWidth: this specifies the length of the R-levels plots (in bars) that the lines are drawn

DeleteLinesOnTradeClose: if set to true then the plot lines are removed once the trade is closed. If set to false then they will remain on the chart after the end of the trade

DeleteLinesOnEARemoval: if set to true then the plot lines are removed once the EA is removed from the chart. If set to false then they will remain on the chart after the EA is removed.

LineThickness: this specifies the thickness of the R level plot lines

Line_Colour: this specifies the colour of the R level plot lines

LineStyle: this specifes the style (e.g. solid, dotted etc.) of the R level plot lines

Font_size: this specifies the size of the font that is used to label the R level plot lines

Font_type: this specifies the font that is used to label the R level plot lines

Font_Colour: this specifies the colour of the font that is used to label the R level plot lines

LevelLabelOffset: this specifies where the label is drawn in relation to the R level plot lines

Saturday 8 January 2000

Metatrader4: "SDS Simple Pin Bar Alerts" Indicator

Introduction

This indicator marks Pin Bars (bars with an unusually long upper or lower candle wick) on your chart. It will also send alerts when one forms, including via e-mail or push notification to your phone. It's ideal for when you want to be notified of a Pin Bar set-up but don't want to have to sit in front of your chart all day.


Click on the link below to inspect/buy this indicator from the MQL5 website
Buy Pin Bar Alerts customer indicator in the store selling algo trading systems


Pin Bar Indicator in action

You can configure all the settings including:
  • What proportion of the bar should be made up of the wick
  • How big or small the total size of the Pin Bar has to be
  • Optionally whether the Pin Bar has to be making a new extreme (e.g. new high for a bearish Pin Bar or new low for a bullish Pin Bar). 
  • What symbol (if any) is plotted to highlight a Pin Bar
  • How far beyond the bar it is plotted
  • What alerts to receive out of pop-up desktop, e-mail and push notification to your phone

Input Parameters

DoAlert: if set to true a desktop pop-up alert will appear from your MetaTrader terminal whenever an Inside Bar forms

DoNotification: if set to true then a push notification message will appear on your MetaTrader smart phone app

DoEmail: if set to true then an e-mail will be sent to your e-mail address with the alert information in

MinimumTailSize: this is the fraction of the total range of the bar that the long wick has to be

MinRangePnts: this is the smallest size the total range of the Pin Bar can be still to qualify.

MaxRangePnts: this is the largest size the total range of the Pin Bar can be still to qualify.

NB if running this indicator on a large timeframe please ensure that you've set the MaxRangePnts input to a sufficiently large value so that your Pin Bars will still plot

RequireNBarExtreme: if set to true then for a bullish Pin Bar the low of the bar must be the lowest of the last N bars (where N is set by the NBarExtreme parameter) & v.v. for a bearish Pin Bar.

NBarExtreme: if RequireNBarExtreme is set to true then this specifies how many bars to look back to see if the Pin Bar is at an extreme

MarkPinBarOnChart: if set to true then it will mark all historic and current Pin Bars on the chart

PlotAboveBar: if set to true then the symbol for marking the Inside Bars will appear above the chart; if false then it will appear below the chart

BullPinBarSymbol: this is the Wingdings symbol code that will be used to mark a bull Pin Bar. You can choose from any of the Wingdings codes (see the chart below)

BearPinBarSymbol: this is the Wingdings symbol code that will be used to mark a bear Pin Bar. You can choose from any of the Wingdings codes (see the chart below)

PlotOffsetPnts: this is the offset in points (the minimum Metatrader price fluctuation) from the high or the low of the bar where the symbol will be plotted. The bigger the number here the further beyond the bar the symbol will be plotted. If you find that your plots are overlapping the bar then you need to increase this number

Wingdings codes


Click on the link below to inspect/buy this indicator from the MQL5 website
Buy Pin Bar Alerts customer indicator in the store selling algo trading systems

Friday 7 January 2000

Metatrader4 "SDS Simple RSI Alerts" Indicator

Introduction

This indicator plots the RSI indicator on your chart. It also highlights overbought and oversold levels with different colours. It will also send alerts when the RSI indicator becomes overbought or oversold, including via e-mail or push notification to your phone. It's ideal for when you want to be notified of RSI overbought/oversold set-up but don't want to have to sit in front of your chart all day.


Click on this link below to inspect/buy this indicator on the MQL5 web-site
Buy RSI Levels Alert customer indicator in the store selling algo trading systems


The "Simple RSI Alerts" indicator in action

You can configure all the settings including:
  • What the levels are to define overbought and oversold
  • What colours are used to plot the overbought and oversold levels
  • Whether to be alerted on the RSI indicator entering the extreme region or leaving it or both
  • What alerts to receive out of pop-up desktop, e-mail and push notification to your phone

Input Parameters


RSIPeriod: the lookback period of the RSI indicator

Overbought Level: the value of the RSI indicator where the market is defined to be overbought

Oversold Level: the value of the RSI indicator where the market is defined to be oversold

AlertType: trigger alerts when the market enters an extreme (overbought or oversold) region, when it leaves an extreme region or both

DoAlert: if set to true a desktop pop-up alert will appear from your MetaTrader terminal whenever an Inside Bar forms

DoNotification: if set to true then a push notification message will appear on your MetaTrader smart phone app

DoEmail: if set to true then an e-mail will be sent to your e-mail address with the alert information in


Click on this link below to inspect/buy this indicator on the MQL5 web-site
Buy RSI Levels Alert customer indicator in the store selling algo trading systems

Thursday 6 January 2000

MetaTrader4 "SDS Engulfing Bar Alerts" Indicator

Introduction

This indicator marks Engulfing Bars (bars with a higher high and a lower low than the previous bar) on your chart. It will also send alerts when one forms, including via e-mail or push notification to your phone. It's ideal for when you want to be notified of an outside bar set-up but don't want to have to sit in front of your chart all day.


Click on this link below to inspect/buy this indicator on the MQL5 web-site
Buy Engulfing Bar Alert customer indicator in the store selling algo trading systems


The Engulfing Bar Indicator at work

You can configure all the settings including:
  • Whether it should be "range engulfing" (so high is higher than previous bar and low is lower than previous bar),  or "body engulfing" (so just the candle body needs to engulf the previous bar's body), or both (so range and body engulfing)
  • What symbol (if any) is plotted to highlight an outside bar with different ones for bull and bear engulfing bars
  • How far beyond the bar it is plotted
  • What alerts to receive out of pop-up desktop, e-mail and push notification to your phone

Input Parameters


DoAlert: if set to true a desktop pop-up alert will appear from your MetaTrader terminal whenever an Outside Bar forms

DoNotification: if set to true then a push notification message will appear on your MetaTrader smart phone app

DoEmail: if set to true then an e-mail will be sent to your e-mail address with the alert information in

MarkOutsideBarOnChart: if set to true then it will mark all historic and current Outside Bars on the chart

EngulfType: this sets the type of engulfing bar to highlight. You can choose from one of:
i) High Low Engulfing Bar (where the high and low of the current bar must be outside the previous bar)
ii) Body Engulfing Bar (where just the candle body must engulf the previous bar candle body)
iii) Both (where the current bar must engulf both the body and the high/low range.

BearEngulfSymbol: this is the Wingdings symbol code what will be used to mark an engulfing bar that closes down (so making a bearish candle). You can choose from any of the Wingdings codes (see the chart below)

BullEngulfSymbol: this is the Wingdings symbol code what will be used to mark an engulfing bar that closes up (so making a bullish candle). You can choose from any of the Wingdings codes (see the chart below)

PlotOffsetPnts: this is the offset in points (the minimum Metatrader price fluctuation) from the high or the low of the bar where the symbol will be plotted. The bigger the number here the further beyond the bar the symbol will be plotted


Wingdings codes

Click on this link below to inspect/buy this indicator on the MQL5 web-site
Buy Engulfing Bar Alert customer indicator in the store selling algo trading systems

Wednesday 5 January 2000

MetaTrader4 "SDS Inside Bar Alerts" Indicator

Introduction

This indicator marks Inside Bars (bars with a lower high and a higher low than the previous bar) on your chart. It will also send alerts when one forms, including via e-mail or push notification to your phone. It's ideal for when you want to be notified of an inside bar set-up but don't want to have to sit in front of your chart all day.


Click on the link below to inspect/buy this indicator from the MQL5 website

Buy Inside Bar Alerts customer indicator in the store selling algo trading systems


The Inside Bar Alerts indicator in action

You can configure all the settings including:

  • What symbol (if any) is plotted to highlight an inside bar
  • Whether the symbol is plotted above the bar or below the bar
  • How far beyond the bar it is plotted
  • What alerts to receive out of pop-up desktop, e-mail and push notification to your phone
Input Parameters


DoAlert: if set to true a desktop pop-up alert will appear from your MetaTrader terminal whenever an Inside Bar forms

DoNotification: if set to true then a push notification message will appear on your MetaTrader smart phone app

DoEmail: if set to true then an e-mail will be sent to your e-mail address with the alert information in

MarkInsideBarOnChart: if set to true then it will mark all historic and current Inside Bars on the chart

PlotAboveBar: if set to true then the symbol for marking the Inside Bars will appear above the chart; if false then it will appear below the chart

InsideBarSymbol: this is the Wingdings symbol code that will be used to mark the Inside Bar. You can choose from any of the Wingdings codes (see the chart below)

PlotOffsetPnts: this is the offset in points (the minimum Metatrader price fluctuation) from the high or the low of the bar where the symbol will be plotted. The bigger the number here the further beyond the bar the symbol will be plotted

Wingdings codes


Click on the link below to inspect/buy this indicator from the MQL5 website
Buy Inside Bar Alerts customer indicator in the store selling algo trading systems

Tuesday 4 January 2000

How to Use the RPA Forex Tester Strategy

This article is a practical guide for users of the RPA ForexTester Strategy. For a review of the ForexTester back-tester software see here. For installation instructions for the RPA strategy, see here.

Having installed your RPA software, how do you go about using it? This is a guide to setting up and using the strategy once it has been installed

Strategy Input Parameters

Select the "Testing | Strategies List" menu option (or use the toolbar button). This will bring up the "Strategies list" dialog box where you should see the RPA strategy listed

The Strategies List
There are a number of input options which are described below:


The first set of inputs
1. Currency Pair. This has to be set to the market that you are trading, otherwise nothing will work. For example, if back-testing GBP/JPY then set it to GBPJPY (so the name matches your market data exactly).

2, Time-frame. This has a drop-down to select one of the time-frame options. Once again, if you've got this set incorrectly then you will not see anything happening on the chart.

In general, if you are wondering why you're not seeing anything happening on the chart, then it's probably one of these two options which is incorrectly set.

3. Entry Method. This can be set to one of two options: "bracket bar" or "use pending order levels". The former option will generate entry and stop levels using pip offsets from the current bar. The latter option will look for pre-existing entry and stop levels and use those as the two levels. 

4. Trade Direction. Long or short. Note that this overrides the "use pending order levels" trade direction if using that option so you may have entered a long trade and a stop level but if your Trade Direction input is set to short then it will use the lower level (the long stop level) as the entry and the upper level (the long entry) as the stop loss.

4. Entry Offset (points). For "bracket bar" mode this is the offset in points (i.e. the minimum fluctuation, usually a pipette) beyond the high and the low of the bar to place the order elvels

5. Risk Definition. There are two options for doing the risk calculation: "Pct of equity balance" or "Specific $ value". The former option will use a fixed percentage of the current equity balance to determine the risk; the latter option will instead use a fixed $ value which means that each trade will always risk the same amount.

6. Risk Specific $ Value. If using the second option in 5 above then this is where the specific $ value is set

7. A/c pct to risk. This is where the percentage that you want to risk per trade is set

8. A/c Pct Return This is where the total target return is set if all your trades come off.


The second set of inputs
9 Take Profit (points) this is the total number of points that the market has to move (from the initial entry) all the way to where all the take profit orders are. So it's the take-profit distance for your original entry order

10. 1st Add-on at % of final TP this is at what percentage of the total Take Profit distance (i.e. input 9) you want to place your first add-on.

11. 2nd Add-on at % of final TP this is at what percentage of the total Take Profit distance (i.e. input 9) you want to place your second add-on.

12. 3rd  Add-on at % of final TP this is at what percentage of the total Take Profit distance (i.e. input 9) you want to place your third add-on.

13. Show Trade Summary Before Execution if set to true then it will show a summary of all the trade information for you to check

14. FX Conversion Rate this is where you can set your FX conversion rate for pairs where the profits are not in USD. It is also possible to load in the appropriate conversion rate data in which case it will use that but it's often more convenient (and quicker as you don't have two sets of data to update) to set the figure here. A bit of trial and error will usually work out what figure to use here. Obviously for XXXUSD pairs this should be set to 1.0


Switching the Strategy On and Off

It's important that you grasp this aspect of using the strategy. Once the strategy has been applied then it runs through the complete of add-ons once and once the trade completes, either with a take-profit or a stop-out then that's it and it won't do anything else. In order to apply it again then it needs to be re-set.

Enabling
To enable the strategy you need to tick the check-box next to the strategy name. Note that this doesn't make the strategy live yet (see below)

Enabling the strategy by ticking the check box

Going Live
Actually to go live with the strategy (so that it brackets the current bar etc.) you need, in testing mode, to select the Testing | Enable/Disable Strategy Execution option (or use the toolbar button). If you then advance the test one tick or one bar, you will see the orders being generated. 

Resetting
Once your trade cycle has been completed then to re-set the strategy simply untick and then re-tick this check box. In the journal tab you will see a message that the strategy has been reset (providing you had actually started the trade cycle). You should then disable the strategy execution until then next time that you want to apply it.


Seeing it in Action

You can see some video of the strategy in action in the description of the strategy here.


Monday 3 January 2000

Installation Instructions for the Risk-free Pyramid Addon Strategy for ForexTester

This post is specifically about how to install the Risk-free Pyramid Addon (RPA) Strategy into ForexTester.

The RPA strategy will be supplied to you as a Windows DLL library, so a file called RPA.dll. To install:

1. Shut down your copy of ForexTester

2. Find the folder where ForexTester is installed. This is usually something like
C:\ForexTester3\
(or C:\ForexTester2\ if you're running the older version)

3. Find the Strategies sub-folder (so C:\ForexTester3\Strategies for example) and copy the RPA.dll file there.

4. Re-start ForexTester and select the "Testing | Strategies List" menu option (or use the toolbar button). This will bring up the "Strategies list" dialog box where you should see the RPA strategy listed
The Strategies list dialog box
5. Make sure that the RPA strategy is highlighted and then click on the Properties button which will bring up the Strategy Properties dialog

Strategy properties dialog box
6. You will see a Hardware ID there (it won't be the same as in the picture above), copy it to your clipboard and then e-mail it to info@snapdragonsystems.com along with your name so that your payment status can be checked.

7. Close the two open dialog boxes and wait for an e-mail with your registration codes.


Installing Your Registration Code

1. You will be e-mailed a simple registration file called RPA.reg. Copy this to any convenient location on your computer, then right-click on it and select Merge (this may be different on different Windows operating systems). Alternatively you can simply double-click on it.

2. Again, depending on the operating system, you may well get one or more messages asking if you're sure that want to make changes to your computer and registry and you may need to give Admin permission to this but rest assured that it's just installing a very simply entry to the registry. If you're in any doubt you can open the file in a text editor (it's a simple text file) to see the contents.

3. Once this has been successfully installed then re-start ForexTester and once again open up the RPA properties dialog box. This time you should see various input parameters as in the image below.

The properties dialog once you have successfully registered
In the ForexTester Journal tab you should also see a message stating that the software is registered

The Journal tab after successful registration
4. That should be it! Please refer to separate instructions on how to use the software (which will be posted as a separate blog entry).


Troubleshooting
If you have any problems with any part of this installation then one useful tip is to look at the Journal tab of ForexTester where helpful information is printed out. There you should see any error messages appear when ForexTester tries to load up the RPA DLL. Various messages about the registration status of the software are also printed out here.

An example of the journal entry for when the RPA strategy hasn't been registered - click to view full size
Having checked in the Journal tab then next step would be to get in touch with Snapdragon Systems at info@snapdragonsystems.com


Sunday 2 January 2000

How to Use the ForexTester Easy Order Entry Script

This article is a practical guide for users of the EOE ForexTester Script. For a review of the ForexTester back-tester software see here. For installation instructions for the RPA strategy, see here.

Having installed your EOE software, how do you go about using it? This is a guide to setting up and using the strategy once it has been installed

Script Input Parameters

To bring up the script dialog box, right-click on one of the two Easy Order Entry scripts in the script window and select Edit Script Properties.


There are a number of input parameters to go through here.

1, Hot Key
This allows you to specify a key combination for executing the script. There are a number of options available in the drop-down so simply select an appropriate one.

2. Currency Pair
You must set this to the pair that you are trading. Otherwise you'll be scratching your head and wondering why nothing is happening when you apply the script.

3. Time-frame
Likewise, you must set this to same time-frame as the chart that you are working on, otherwise nothing will happen

4. Entry Method
There are two options here: Bracket Bar and Use pending order levels

In Bracket Bar mode, when the script is applied it takes the last bar on the chart and places the order and stop loss at either end of the bar (with appropriate offset, see below).

In Use pending order levels mode, when the script is applied it searches for pre-existing entry and stop-loss orders already on the chart. In this case the script will delete these orders and replace them with ones at the same level but with the desired risk sizing.

5. Trade Direction
This will either be long or short. For your convenience, two versions of the script are supplied, one with the default set to long and one to short. This way you can simply use whichever one you want without having to change settings on every trade

6. Entry Offset
This is the offset in points (the smallest allowable fluctuation in the price) from either end of the bar for the entry stop order and stop loss. Note, the spread will be correctly accounted for as well at the high of the bar.

7. Risk Definition
This is one of two options: specific $ value or Pct of equity balance

For specific $ value then you specify the fixed USD amount from which you want your risk percentage to be taken. In other words, this is as if you have a fixed account size of this amount so no compounding will occur.

For Pct of equity balance then the current equity account value is used for risk calculations. This means that your account trades will be compounded.

8. Act pct to risk
This is the percentage of the risk definition amount that is risked on each trade

9. Take Profit Type
This is either Reward to Risk or Fixed Points

With Reward to Risk then the Take Profit level is set to a fixed multiple of the initial risk amount. So with a value of 2.0 then you would make twice what you risked if your take profit level is reached

With Fixed Points then the take profit level is a fixed number of points (the minimum price fluctuation).

10. FX Conversion Rate
This is where you can set your FX conversion rate for pairs where the profits are not in USD. It is also possible to load in the appropriate conversion rate data in which case it will use that but it's often more convenient (and quicker as you don't have two sets of data to update) to set the figure here. A bit of trial and error will usually work out what figure to use here. Obviously for XXXUSD pairs this should be set to 1.0 but as a rule of thumb for XXXJPY pairs then 0.01 works reasonably well.


Using The Script


Once the input parameters have been set up correctly then you can apply the script to the chart any time that you want to make a trade either by using the Hot-key combination, or by double-clicking on the script in the Scripts Window.


Saturday 1 January 2000

ForexTester Easy Order Entry Script - Installation Instructions

This post is specifically about how to install the Easy Order Entry (EOE) script into ForexTester.

The EOE script will be supplied to you as a pair of Windows DLL libraries, so files called EasyOrderEntryLONG.dll and EasyOrderEntrySHORT.dll

To install:

1. Shut down your copy of ForexTester

2. Find the folder where ForexTester is installed. This is usually something like
C:\ForexTester3\
(or C:\ForexTester2\ if you're running the older version)

3. Find the Scripts sub-folder (so C:\ForexTester3\Scripts for example) and copy the  two dll files there.

4. Re-start ForexTester and find the Scripts panel. This is usually on a tab next to the Data Window but if you can't find it then go to the View | Show Panels | Scripts menu option, making sure that there's a tick next to it. You should see the two scripts listed there though you won't initially see anything in the Hotkey section

The Scripts panel
    5. Right click on one of the scripts and select Edit Script Properties. This will bring up the script properties dialog box. The first time that you do this you will see a message like the one below saying that your software has not yet been registered.


    6. You will see a Hardware ID there (it won't be the same as in the picture above), copy it to your clipboard and then e-mail it to info@snapdragonsystems.com along with your name so that your payment status can be checked.

    7. Close the open dialog boxes and wait for an e-mail with your registration codes.


    Installing Your Registration Code

    1. You will be e-mailed a simple registration file called EOE.reg. Copy this to any convenient location on your computer, then right-click on it and select Merge (this may be different on different Windows operating systems). Alternatively you can simply double-click on it.

    2. Again, depending on the operating system, you may well get one or more messages asking if you're sure that want to make changes to your computer and registry and you may need to give Admin permission to this but rest assured that it's just installing a very simply entry to the registry. If you're in any doubt you can open the file in a text editor (it's a simple text file) to see the contents.

    3. Once this has been successfully installed then re-start ForexTester and once again open up the EOE properties dialog box. This time you should see various input parameters as in the image below.

    The EOE properties dialog after registration

    In the ForexTester Journal tab you should also see a message stating that the software is registered


    4. That should be it! Please refer to separate instructions on how to use the software (which will be posted as a separate blog entry).


    Troubleshooting
    If you have any problems with any part of this installation then one useful tip is to look at the Journal tab of ForexTester where helpful information is printed out. There you should see any error messages appear when ForexTester tries to load up the EOE dlls. Various messages about the registration status of the software are also printed out here.

    Having checked in the Journal tab then next step would be to get in touch with Snapdragon Systems at info@snapdragonsystems.com